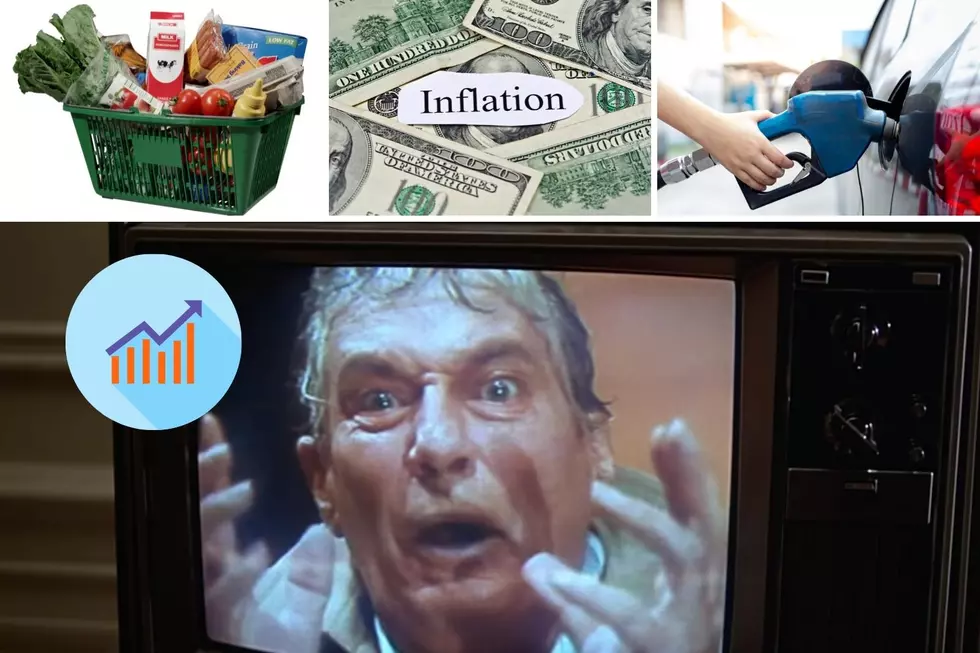
Pain Eases at Pump, But Inflation Remains High for Most Goods
The U.S. Bureau of Labor Statistics will soon report updated numbers related to the Consumer Price Index (CPI). But, of course, this will be followed by a Wall Street reaction and the typical politician and media frenzy to spin the numbers for political advantage for a few days following the CPI update.

But do the CPI numbers accurately reflect the rate of inflation? In short, the answer depends on who you're asking and what their political persuasions may be. The CPI represents the fluctuating prices of all goods and services purchased for consumption by urban households.
Federal-level bureaucrats believe gas prices are too volatile and must be weighted accordingly. So it accounts for less than 6% of the CPI. However, with a recent drop in fuel prices, the pending narrative may include claims that inflation is under control.
A few weeks ago, the average American driver felt pain at the pump. Today, the consumer is celebrating prices plunging back to earth after skyrocketing to record high levels.

When average national gasoline prices hit $5.02 a gallon in June, it amplified the nation's inflation fears. Post-Labor Day, the cost-per-gallon average has become increasingly more palpable with the summer driving season in the rearview mirror.
Although the national average for regular gasoline remains .54 above the cost of a gallon one year ago, the price has dropped significantly and continues to decline daily.
One month ago, the national average price per gallon was $3.978. Last week it averaged $3.786, and today the AAA reports a national average of $3.716 per gallon.
The State of Iowa has seen a decline at the pump too. At $3.381 per gallon, Iowans have seen nearly .22 per gallon savings from last month's cost of $3.599.
However, the price per gallon in Dubuque remains above the statewide average at 3.568 per gallon of regular gasoline.
Meanwhile, AAA reports that the Des Moines metro has an average price of just $3.173. That's a significant difference of .426 per gallon from what drivers pay at the pump in eastern Iowa.
Meanwhile, the average Illinois driver is paying much more than that, with statewide gas prices averaging $4.012 per gallon. Of course, Cook County and Chicago tend to drive up the average cost, with gasoline selling for $4.62.
Closer to the Tri-States, the average price per gallon is $3.866 in Jo Daviess County.
Wisconsin has an average price of $3.465 per gallon. Grant and Fayette Counties are slightly below $3.535 and 3.561, respectively.

See the Must-Drive Roads in Every State
Gallery Credit: Sarah Jones
[/caption]
LOOK: See how much gasoline cost the year you started driving
Gallery Credit: Sophia Crisafulli
More From AM 1490 WDBQ